
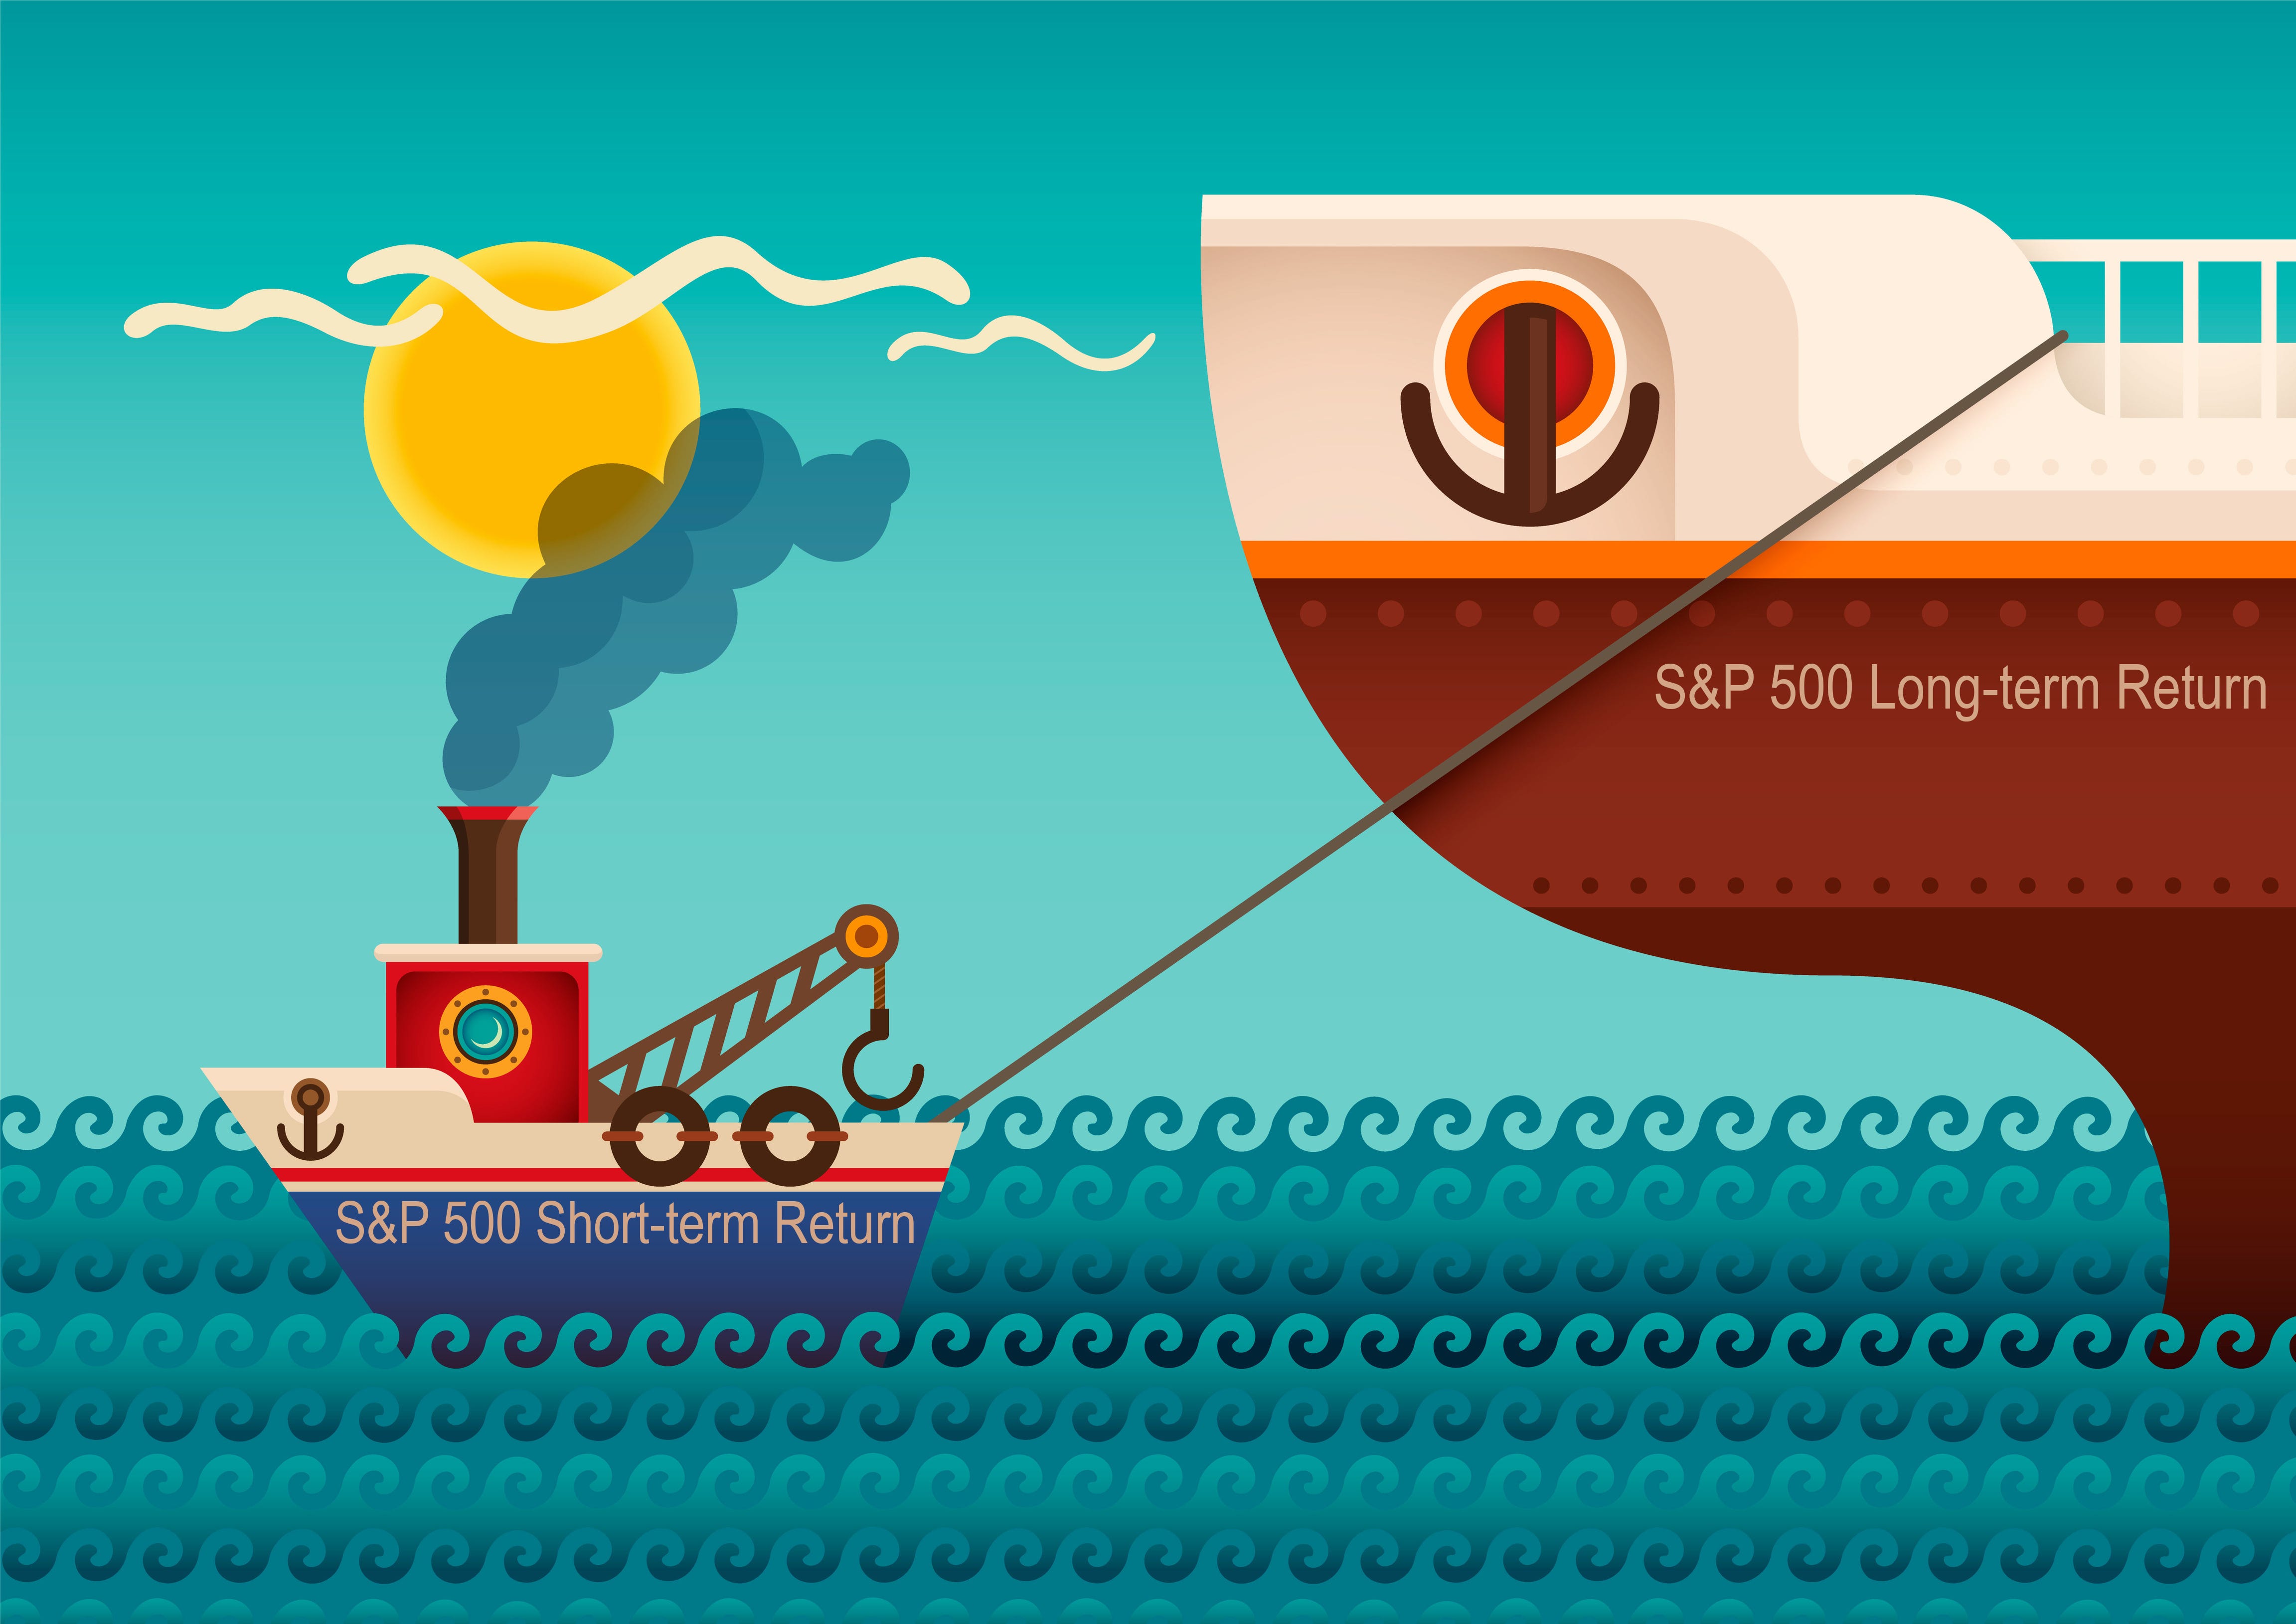
Short-term Stock Market Returns are like Tugboats
Short-term returns pull long-term returns back on course—but they are erratic.

We’ve previously asked the question. . .
How’s the stock market doing?
. . . curious to see how you would answer it.
Typical answers include, “I have no idea” or “It’s been doing great,” and so on.
Of course, we’re hoping that before answering the question, you’ll take a moment to consider whether it’s a good question. If you need a refresher as to why this is important, read our post The Power of Questions (Core Post No 4).
The question above is a bad question.
Why?
Because it doesn’t mention a Time frame.
A Step Further
As we’ve noted before, when it comes to investing, Time changes everything. Change the Time frame and you completely flip the notion of which investment is most or least risky. (And if you don’t understand this, it can cost you a lot of money.)
But let’s take this a step further.
Assume you do ask and answer the question about how the stock market has done with a specific Time frame in mind.
What does it tell you?
Do you think, for example, what happened over the last year will provide any clues as to what might happen over the next year?
The short answer is that what happened over the past year tells us absolutely nothing about what to expect over the next year.
If you care to see the proof—and if charts don’t freak you out too much—then take a look at the wildly scattered dots below.
Pick a percent return on the bottom of the chart and then glance upward. The dots above the percentage you chose show what happened historically over the next year (which you read off the vertical axis to the left).
For example, if the return over the last year was 8%, we’ve seen returns over the next year range from about -40% to +40%. In other words, anything can happen.
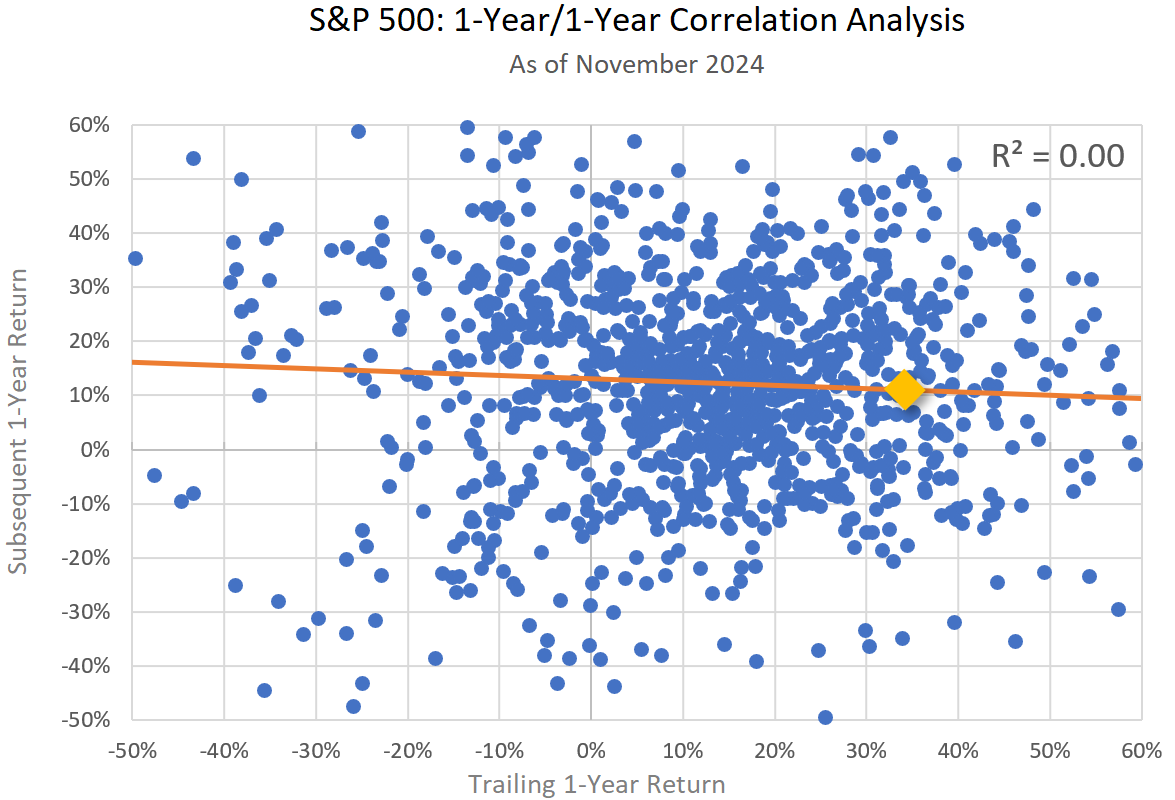
If we want to know whether, mathematically, the trailing 1-year return tells us anything about the subsequent 1-year return, we can look at something called the coefficient of determination (or R-squared). An R-squared of 1 (or 100%) would mean the previous 1-year return completely explains what happened (or what to expect) over the next 1-year period.
This is like observing that if it rains upstream, the water level in a river will rise downstream.
So, what’s the R-squared for our 1-year vs 1-year correlation analysis?
It’s 0.00 (or 0%), meaning that what happened over the last year is absolutely useless in telling us what to expect over the next year.
The orange line is a fitted trendline, but it doesn’t mean much since the R-squared is 0. For what it’s worth, the yellow diamond shows where we are now with a well above-average 1-year return of 33.89%. The fitted trendline would suggest the expected return over the next year would be 11.04% but, again, we can’t rely on this.
When we’ve been here before, the subsequent 1-year return ranged from about -35% to +58%.
A Longer View
Now let’s look at something more interesting.
The chart below shows the trailing 20-year return on the bottom and the subsequent 15-year return on the left.
Why did we pick this combination of return periods?
Because it has the highest R-squared value of any combination of past and future return periods. In this case, what happened over the past 20 years has explained 83% of what happened over the next 15 years. Now that is pretty meaningful.
If we look at 8% again on the bottom, we can see that the subsequent 15 years ranged roughly between 13% and 19%. What this means is that a below-average 20-year return—in this example, a below-average return of 8%—has always been followed by an above-average 15-year return.
In contrast, an above-average return of, for example, 16% was followed by below-average returns ranging between 4% and 6%.
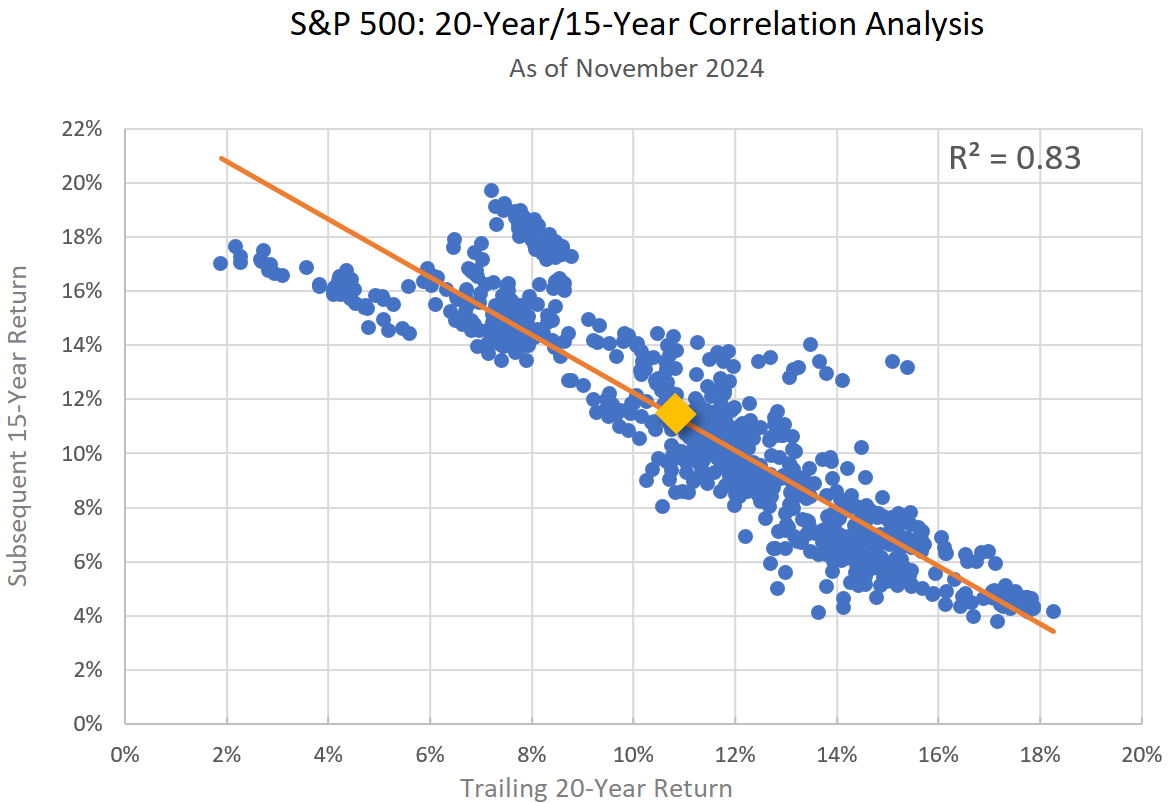
With an R-squared value of .83, the trendline is more meaningful. The trailing 20-year return is 10.82% (which would imply a return of 11.39% over the next 15 years). More importantly, when we’ve been here in the past, the subsequent 15-year return ranged from about 8% to just over 14%.
This suggests there’s no reason to panic about what stocks might do over the next 15 years. If they return less than 8% it would be historically unprecedented.
Focus on the Long-term Returns
As we’ve noted before, for long-term investors, the most important number to know about any investment is the long-term compounding rate. Taking advantage of compounding is how you can build extraordinary wealth.
The challenge is in learning to not get hung up on the short-term swings in the market which can be quite erratic.
One way to think of it is that the “job” of short-term returns is to help move the long-term returns back toward their long-term averages whenever they stray too far from the middle.
It’s like the short-term returns are the tugboat and the long-term returns are the large ship—the thing we really care about.
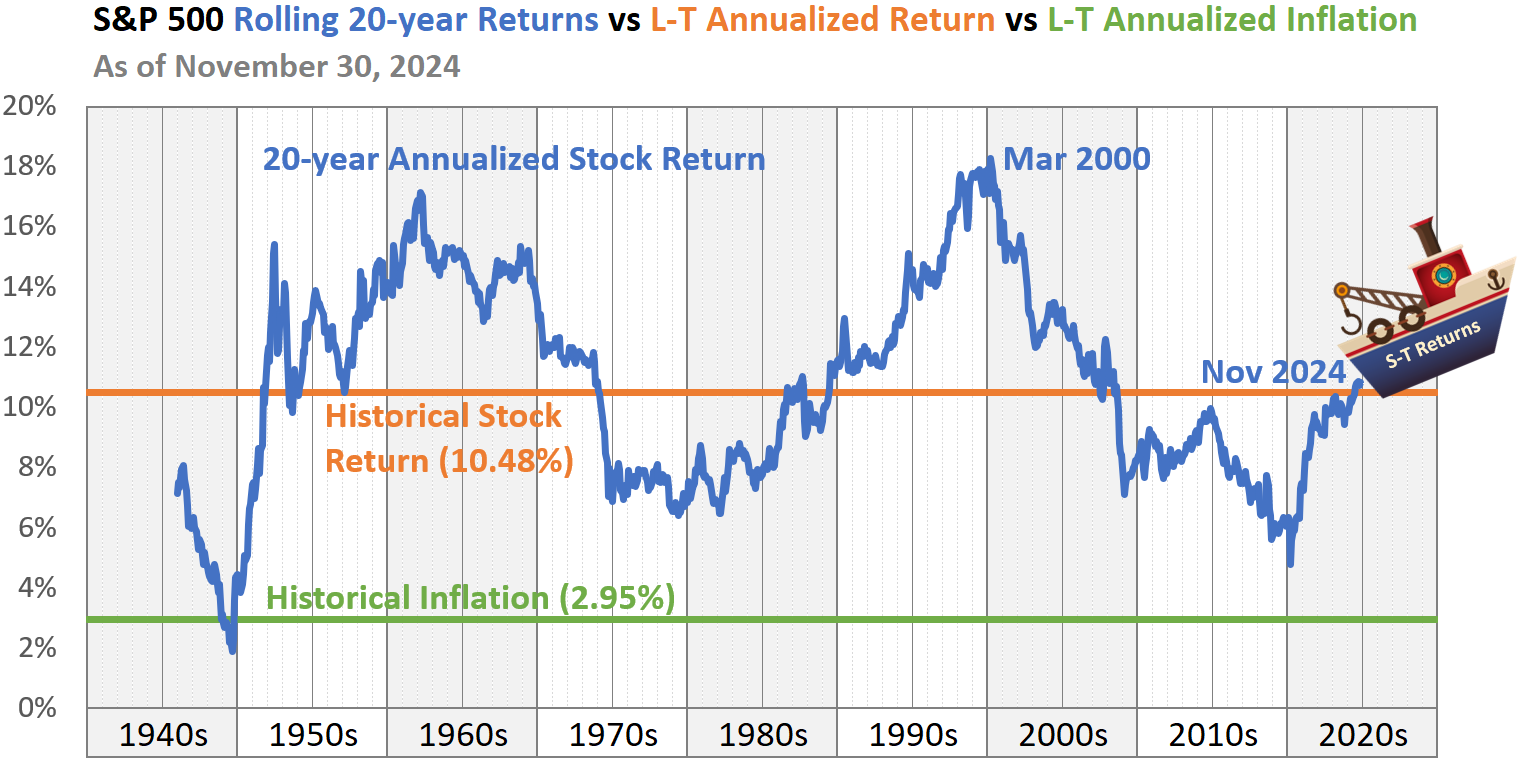
If you look at the chart below, you can see how the 20-year return has meandered around the longer-term annualized return.
In March 2000, the 20-year return had reached all-time highs—just before the “dot com” bubble burst. Pulling the long-term return back toward normal required a few negative short-term returns and, in fact, stock market returns were negative for three consecutive years (2000, 2001, 2002).
Largely due to the Global Financial Crisis of 2008, long-term returns subsequently fell to below-average levels. Pulling the long-term return back up to normal required above-average short-term returns.
The above-average returns we’ve seen recently—which many “experts” view as alarming (because they are only looking at the short-term picture)—has just now brought the long-term return back to the historical average.
What Does This Mean?
First of all, by this measure, we are nowhere near where we were at the beginning of 2000. In fact, we’re pretty average.
Does this chart give us any clues as to what to expect in the near term from stocks?
No, it doesn’t. It’s possible that AI or other factors will continue to propel the stock market upward for some time. It’s also possible that we’ll see a correction—or even a Crash.
It’s simply not possible to predict with any degree of precision.
That doesn’t mean that you can’t make smart investment decisions.
Allocating a large portion of your long-term portfolio (money you won’t use for 15+ years) to Stocks is pretty much a no-brainer. The long-term compounding rate on stocks dwarfs the returns you can expect from the other two major asset classes (Bonds and Cash).
You should not put any Stocks in your short-term portfolio (money you’ll need within 3 to 5 years). We can’t know what will happen with stocks in the near term, but we must acknowledge the real possibility they could go down.
As noted before, stocks lose money roughly one out of every four years.
Of course, we can also count on stocks recovering from any correction or Crash (provided you’re invested in a sufficiently diversified portfolio. A market-cap-weighted index like the S&P 500 is particularly helpful here).
The Bottom Line
Our apologies to those who don’t like math or charts but, hopefully, this perspective will help you focus more on the long-term and less on the short-term results of the stock market.
Where the ship (long-term returns) is going is far more important than the tugboat (short-term returns).
This post may have been more challenging than most. If something didn’t make sense or if you ever have any questions, please contact us directly.
Stuart & Sharon