
Stock Market Returns - September 2024
How did the stock market do and how does it compare to where we were in the late 1990s?

[Note: we will begin posting a review of stock market returns each quarter. This one is a free post but going forward these and other posts commenting on what’s going on currently in the markets will be for paid subscribers. There will always be free weekly educational posts. These periodic paid posts will help put our educational posts into a real-world perspective for those wanting to explore investing more deeply.]
How’s the Stock Market Doing?
What’s your guess for how the stock market (S&P 500 Index) has performed as of September 30, 2024?
You can think in terms of a percentage or simply choose one of these categories that breaks returns into 5 quintiles:
Historically high (top 20th percentile)
Above average (60th to 80th percentile)
Average (40th to 60th percentile)
Below average (20th to 40th percentile)
Historically Low (bottom 20th percentile)
Take a moment to think of your answer before reading further.
So, what’s your guess?
By the way, this post is more about how to frame this question versus whether you get the answer right.
Most importantly:
In answering the question, did you first specify a time frame?
Did you assume we were asking about how the market has performed this year? Over the past 12 months?
Did you consider which Decisions the answer is related to (see Core Post No 1) and choose a relevant Context (see Core Post No 2)?
If you answered this question by first specifying a time frame, then give yourself a gold star! Whether you guessed the actual return is less important. You don’t have to guess, you can see the answers below.
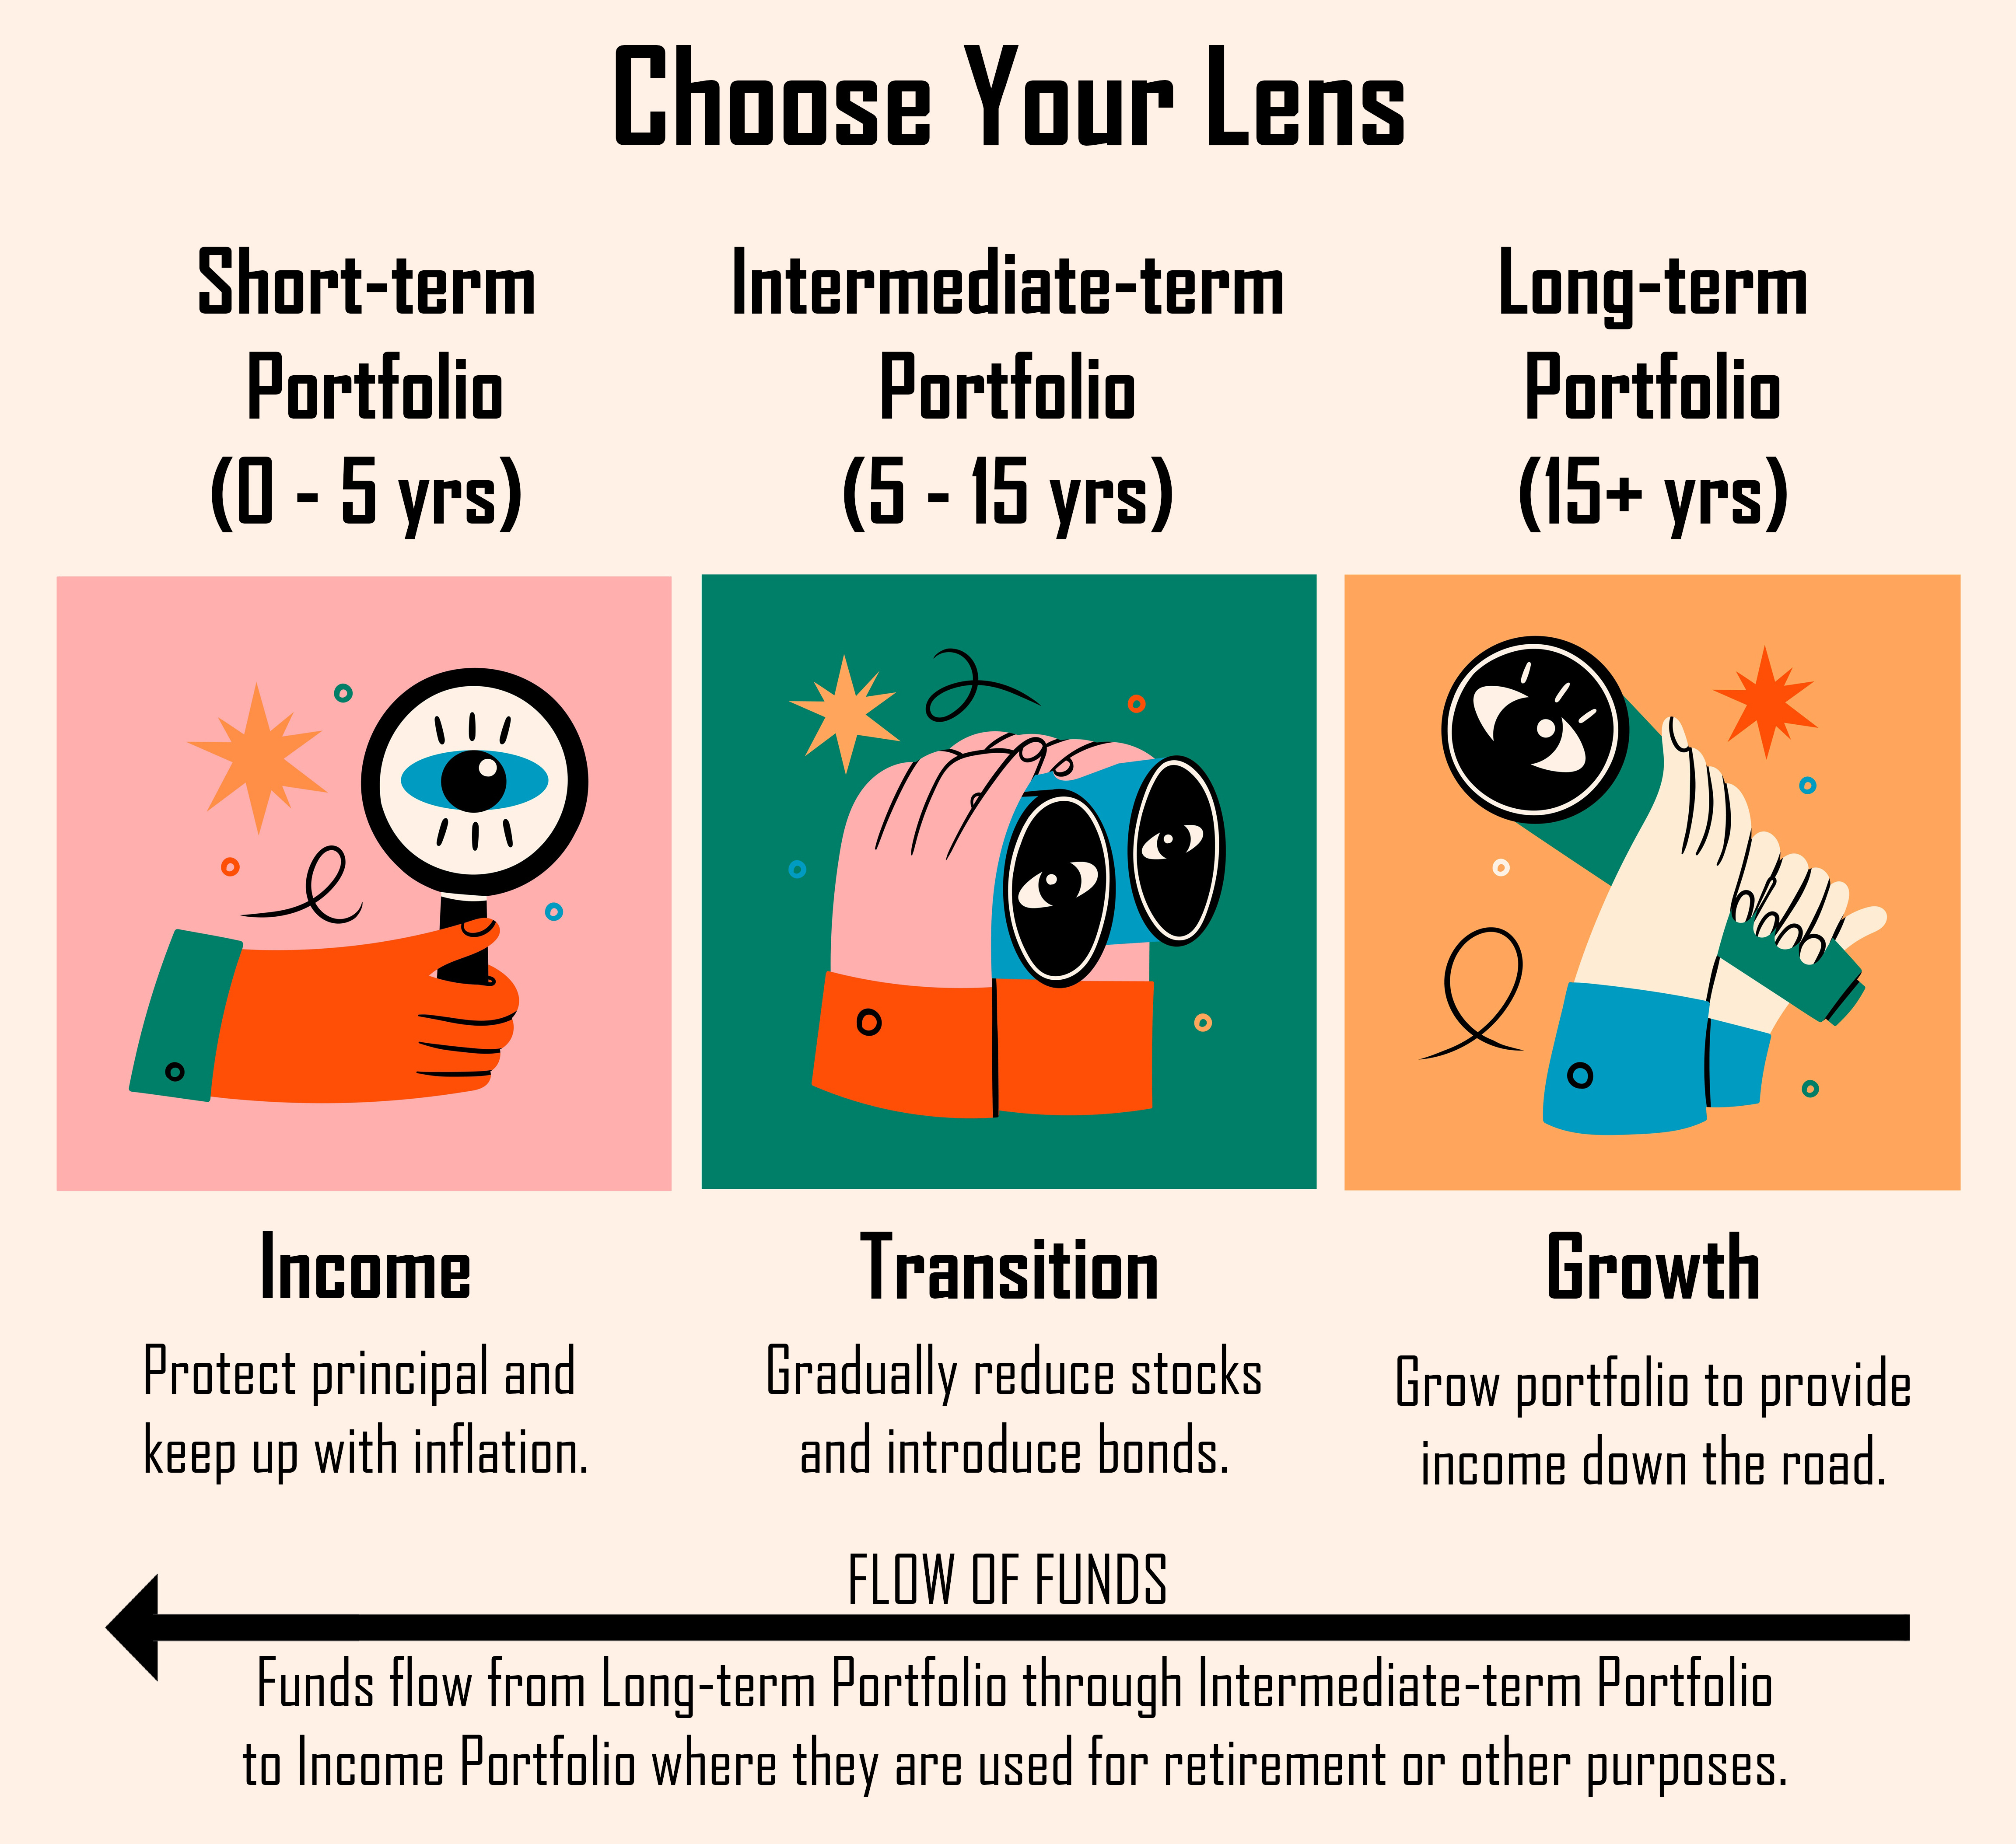
A Quick Recap - Choose Your Lens
Before we show the returns, let’s briefly revisit our post on Perspective (Core Post No 3).
We noted that Stocks are the least risky investment—meaning they give you the best chance of winning, of reaching your goals—in your Long-term Portfolio.
Stocks are the most risky investment in your Short-term Portfolio due to high short-term volatility. For that reason, you should never use Stocks in your Short-term Portfolio.
Your Intermediate-term Portfolio (5-15 years) is a time during which you gradually reduce your allocation to stocks into other assets, typically Bonds.
Current Returns - September 2024
With that background, let’s now look at stock market returns (S&P 500) for various time periods as of September 30, 2024.
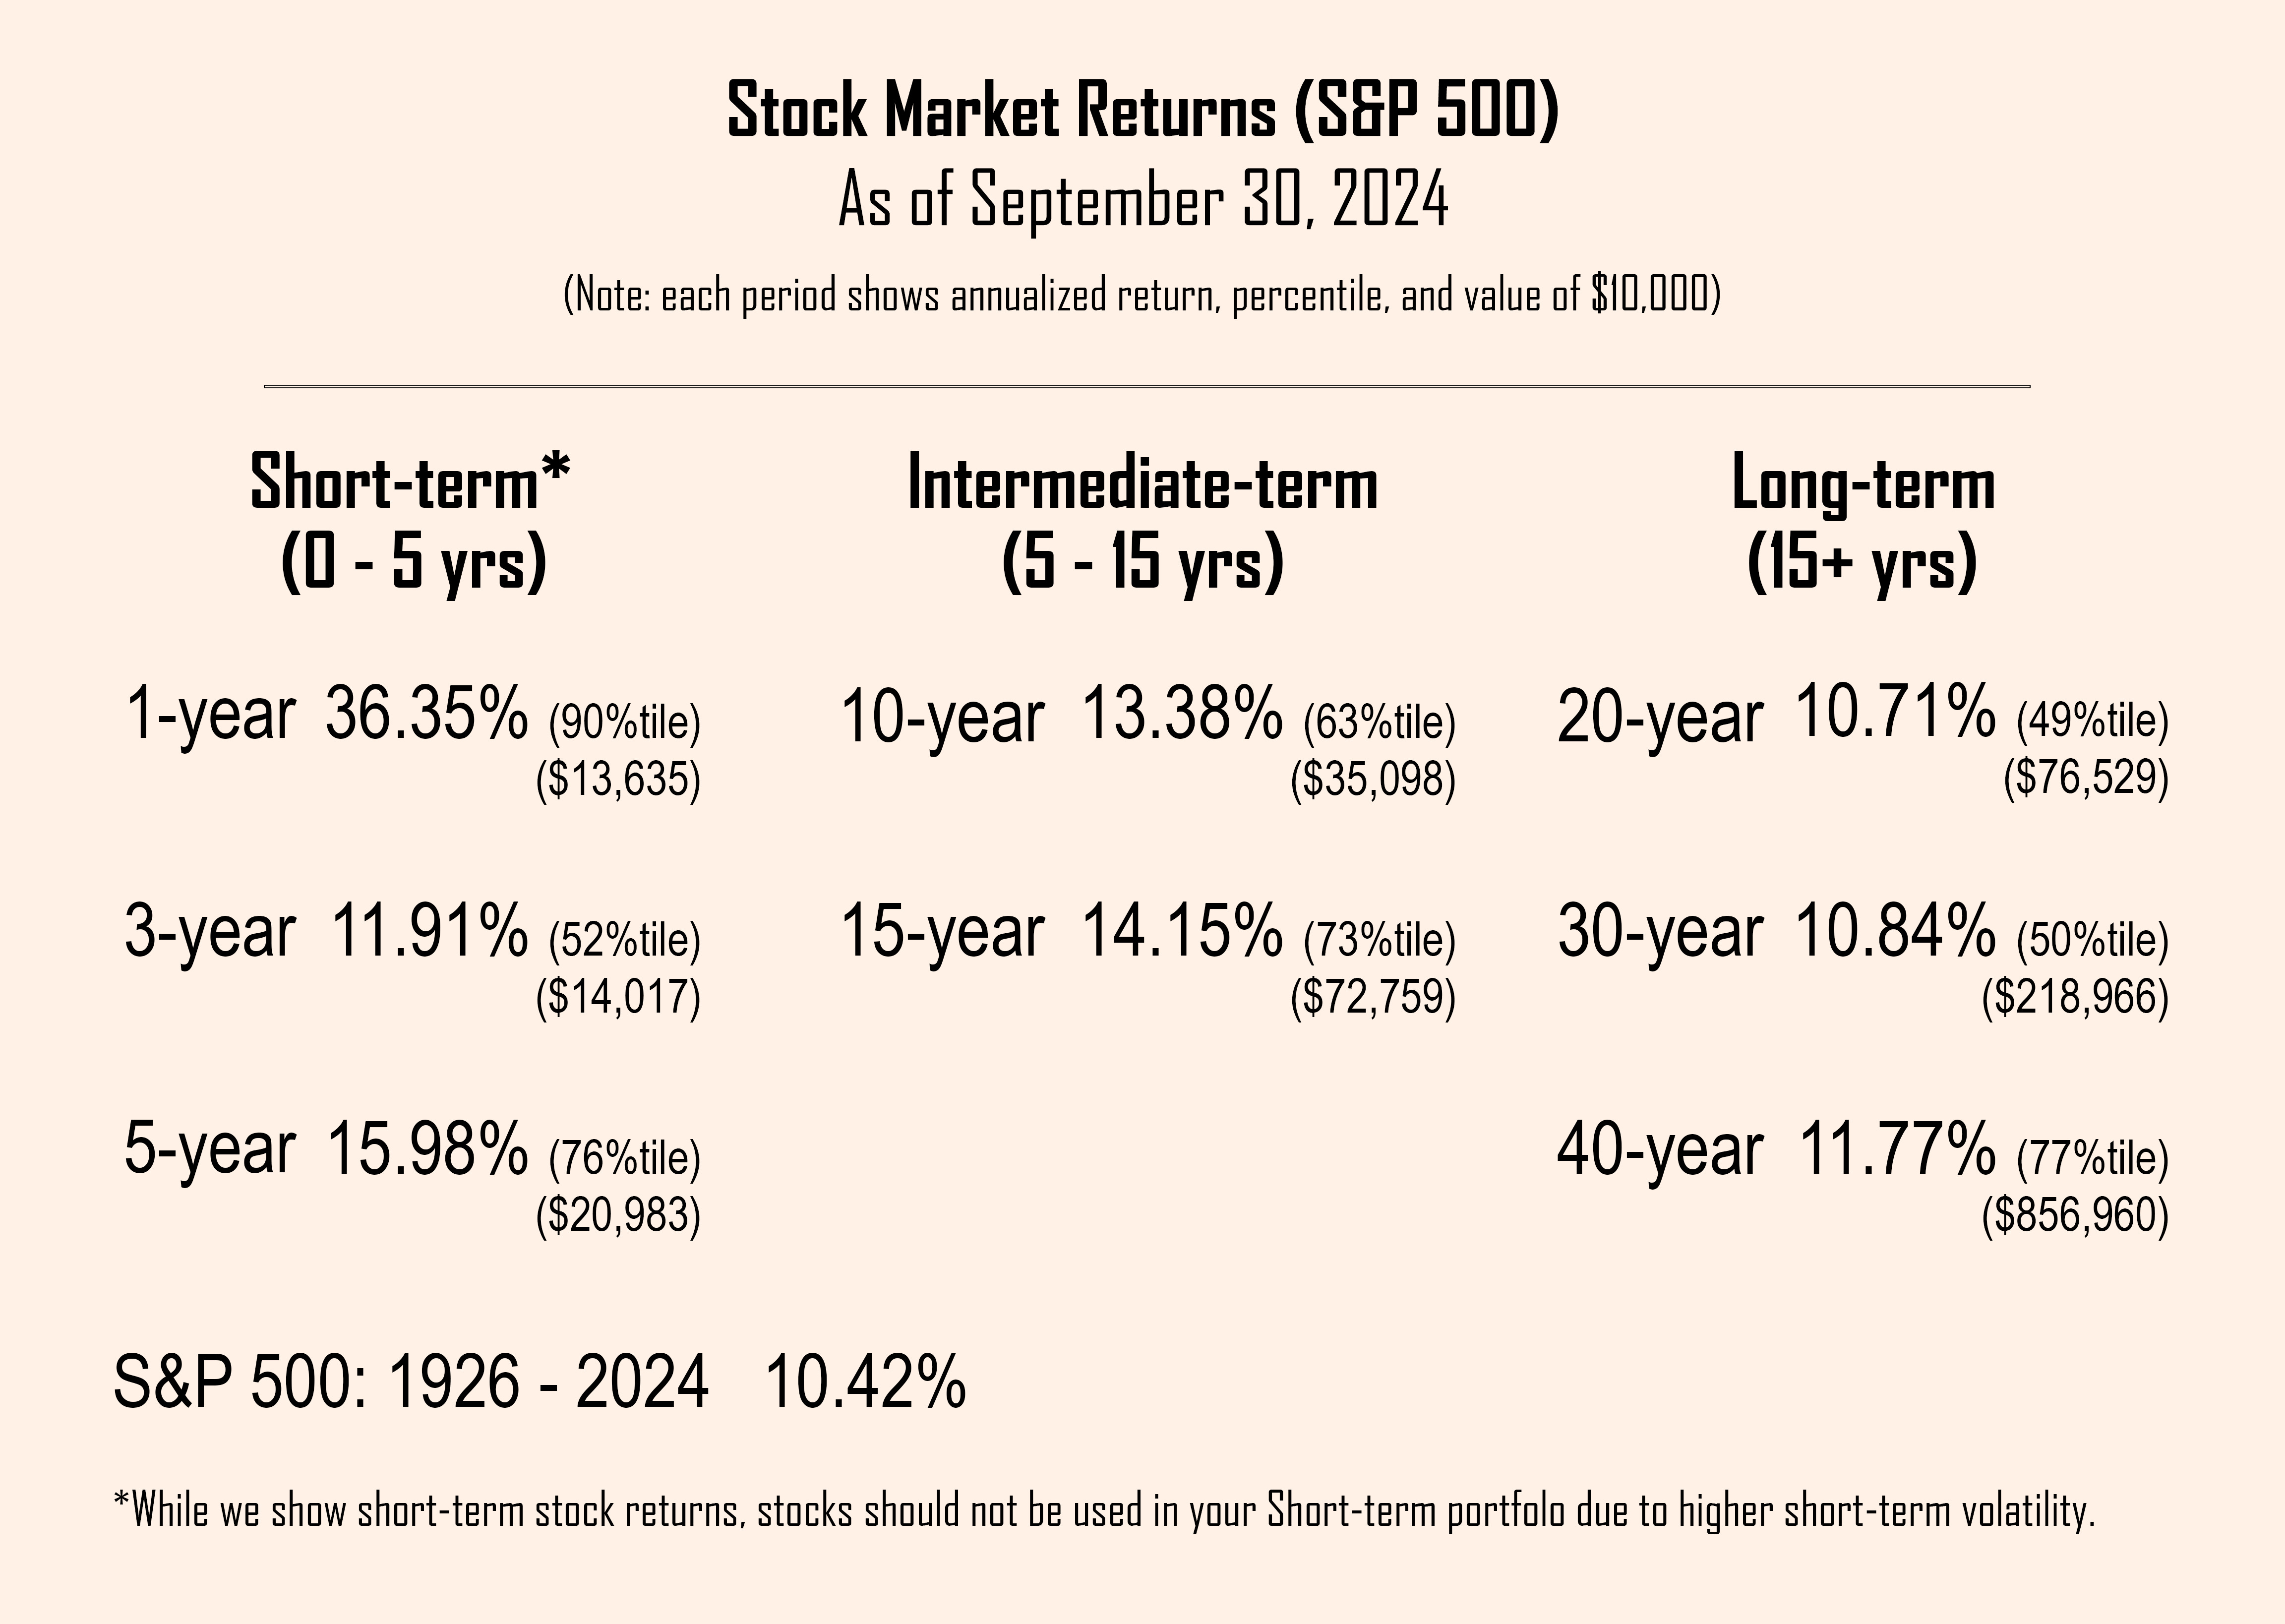
Long-term investors should be most interested in returns in the Long-term category.
If you’ve been investing for 20 or 30 years, your stock market experience has been very average (with 49%tile and 50%tile, respectively).
For anyone who has invested for 40 years, stock market returns have been above average (77%tile).
Intermediate-term returns (5 to 15 years) have been above average.
Short-term returns, especially the past 12 months (90%tile) have been historically high.
While you’re at it, look at the value of an initial $10,000 one-time investment as of each time period (shown below each return). This will help you get a feel for the power of compounding in action (see Core Post No 5).
Choosing the Wrong Lens
We tend to pay most attention to what’s happened recently.
Investing is about growing your money over time, typically a longer time period. Looking at long-term investing through a short-term lens is a common mistake, often leading to costly overreactions when the stock market goes down.
Given the historically high short-term returns we’ve recently experienced, many stock “experts” are saying the stock market is too high and a crash is imminent, similar to the late 1990s.
But that’s not necessarily the case, as we shall see.
25 Years Ago - September 1999
Let’s turn the clock back 25 years. The stock market has been going strong for nearly two decades. In particular the last half of the 1990s have been extremely good for stocks. Later, we’ll call this the dot com era (of course we didn’t know that then).
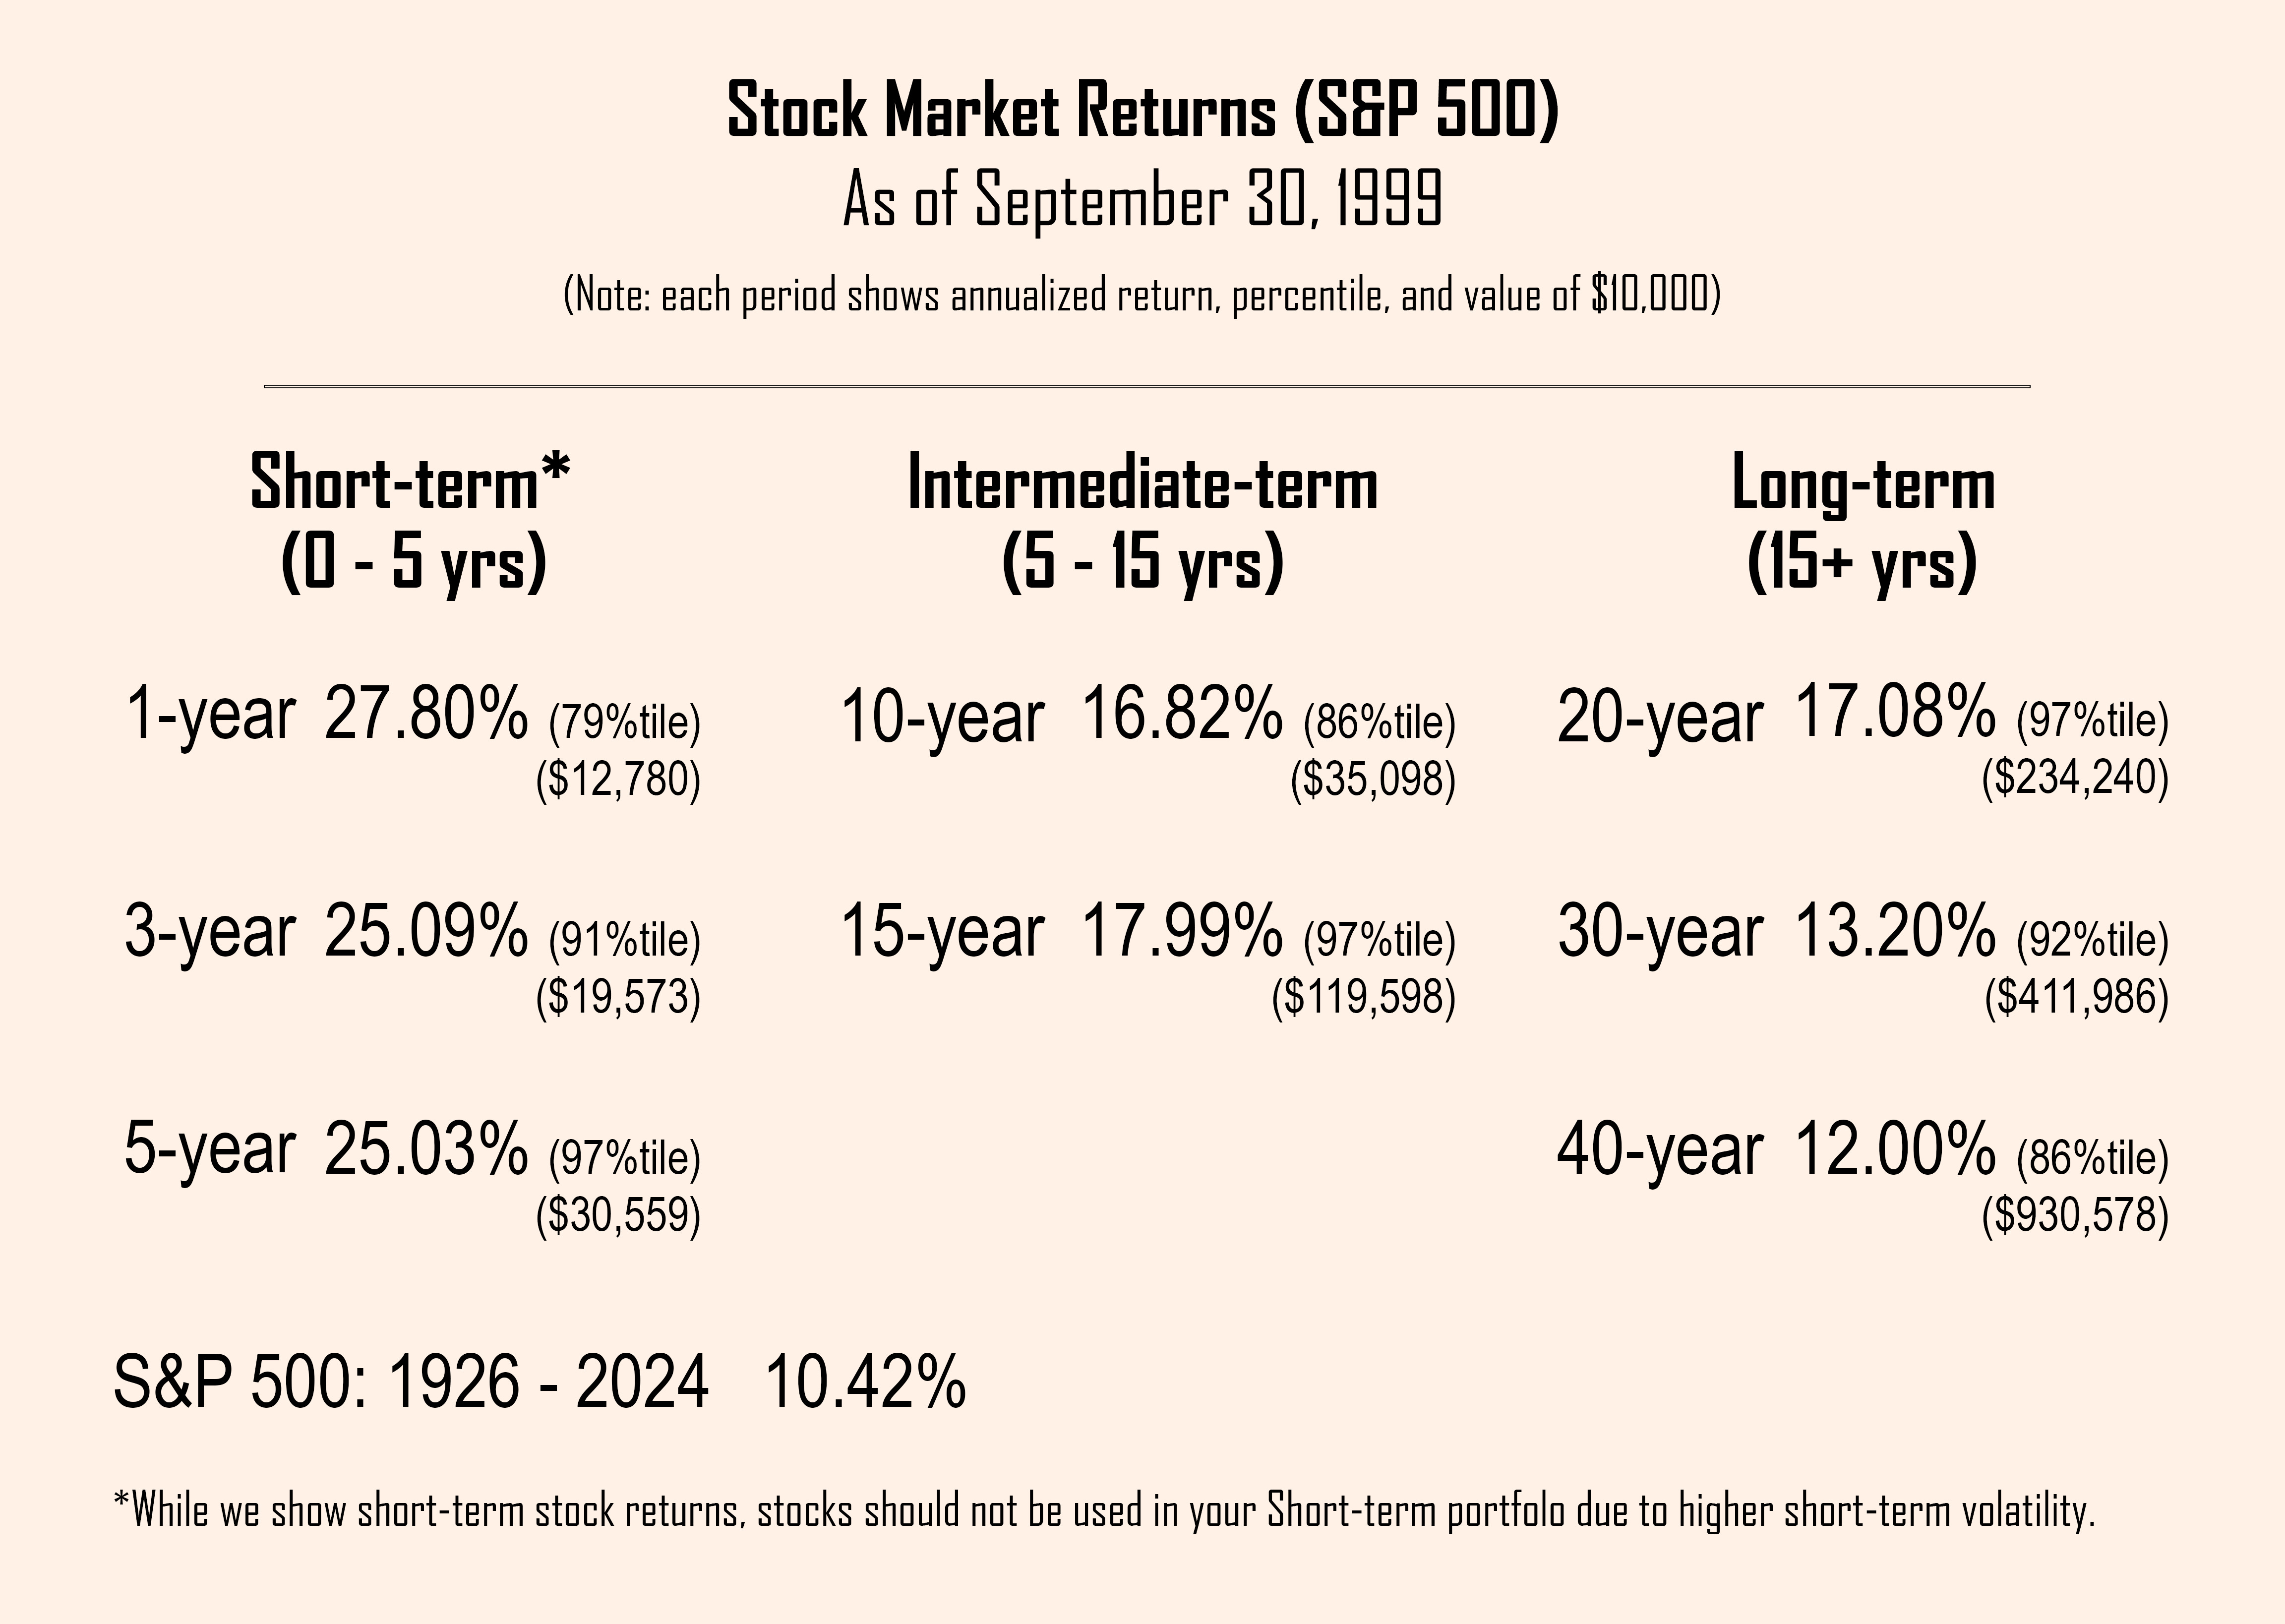
Note that the 1-year return was not as strong as the 1-year return we see today, but take a close look at the percentiles for the Intermediate and Long-term periods, all of which are in the historical high range (above 80%tile).
If you compare these returns with where we are today, you can see that the stock market is nowhere near the extreme levels we experienced in the late 1990s.
When we look at these returns, we pay the most attention to the 20-year return because it has a high correlation with what to expect over the next 15 years (we’ll cover this in more detail in a later paid post).
For now, it’s helpful to note that the current 20-year return is 10.71% (49%tile) while the 20-year return in September 1999 was 17.08% (97%tile).
This suggests that any plausible series of returns going forward is in play given where we are now. It’s impossible to predict, but there’s no reason to believe that we’re at either a low or high extreme.
By contrast, there was reason to be concerned that the market had reached extreme levels by late 1999.
This continued until we reached a high at the end of August, 2000. After that, the dot com bubble burst and we had 3 consecutive negative return years (a rarity in the stock market).
How Did You Do?
We tend to look at our 401(k) or other portfolio statements and look at how we did since the last statement.
This isn’t particularly relevant and can create a great deal of stress if the market has gone down.
For long-term investors, the long-term returns are what matters.
Everything else is just noise.
Speaking of which, do you know how your portfolio has performed over various time periods, including since you started investing?
If not, you should. This will tell you the most important number—your long-term compounding rate on your portfolio.
Keep in mind, you very likely haven’t had all your portfolio invested in stocks so if you’re comparing to market returns, you need to understand how your asset allocation has varied over time (percentage in Stocks, Bonds, and Short-term or other investments).
What you won’t see is how much you could have had if you had chosen another asset allocation strategy.
A common mistake for investors, especially those not familiar with the long-term potential of the different asset classes, is to be too conservative.
The thought is that this makes you less risky, but the reality is it makes you less likely to achieve your long-term financial goals—i.e., it’s more risky.
Reviewing returns, as we’re showing them here, helps improve your understanding of how the market works over time which helps increase your confidence in the process.
Each time we update the current returns, we’ll take a look back at another historical period to help you get a feel for stock market history.
Stuart & Sharon